For as long as design has existed, so too has the argument of form versus function. Which comes first? Which is more important?
On one side are those who believe aesthetics and good-looking design should always come first. After all, design is visual. On the other are those who ask what use a beautiful design is if it doesn’t serve its primary purpose or isn’t usable. And then there are those who argue that both are equally important.
All three points of view have sound arguments behind them. But perhaps we’re having the wrong debate, particularly when it comes to design in healthcare.
It isn’t simply form versus function. It’s brand expression and regulation alongside interpretability. Visual identity and brand consistency build familiarity. Regulation helps ensure transparency and accuracy. Both contribute to trust. But rather than competing with each other, they should work together to overcome a larger barrier: accessibility.
In practice, we’ve found that strong visual identities are invaluable in creating familiarity and consistency across design and tone of voice. Regulation ensures the required information is there to be understood. But it doesn’t matter how carefully a message is written, or how accurate the data is, if the audience cannot interpret it.
Correct does not always mean clear.
An exhaustive data set, accurate to the twentieth decimal place, is only useful if it can be understood. And there are visual worlds that not all of us experience in the same way.
Colour vision deficiency affects a significant proportion of the population. Around 8% of men and 0.5% of women of Northern European ancestry have the common red-green forms of colour vision deficiency,[1] and many people may not realise the extent to which it affects them.
There are also different forms of colour vision deficiency. Someone with anomalous trichromacy may experience a colour palette very differently from someone with dichromacy, and there are further variations within these broad categories. There is no single colour palette that will meet every need.
This matters because we often use colour, and colour alone, to communicate meaning. Grey might represent placebo. Specific colours might identify different drugs or data sets. Red might signal an alert or warning.
Under ideal viewing conditions, that can look polished, create distinction and reinforce a recognisable brand. But what happens when those colours cannot easily be distinguished?
At best, some of that brand distinction is lost. More importantly, communication can begin to break down. Concise data can become ambiguous or even be misinterpreted. You can meet every regulatory requirement for transparency, but if the information isn’t easy to interpret, how useful is it?
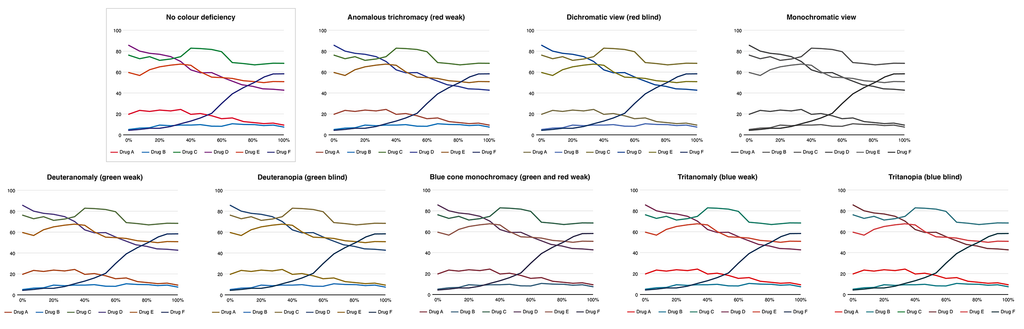
The example below shows how the same data visualisation can appear very different depending on the type of colour vision deficiency, and how distinctions that initially seem obvious can quickly become difficult to identify.
We learn colour associations from a young age. Red can mean danger or anger. Green can suggest money, envy or safety. So it’s no surprise that we use colour as a seemingly simple communication tool within our design language.
But those examples also demonstrate the problem: colours can carry multiple meanings. If colour is the only indicator, how do we know which meaning is intended?
One answer is hierarchy.
Traffic lights are a familiar example. They appear to be simple colour-coded signals, but there is also a clear structure supporting the colour. Red is not only the stop signal, it is positioned at the top. Green is the go signal and is positioned at the bottom. Where an additional green signal is needed, its shape and position provide further information.
Colour is doing some of the work, but it isn’t doing all of it.
We can apply exactly the same principle to design, particularly in medical communications where data is often central to the discussion.
Think of KM curves or line charts containing six, seven or eight different data sets, each identified by colour and defined by a legend beneath the figure. With reduced colour distinction, those lines can quickly become difficult to tell apart.
As a team, we can recall numerous occasions when we’ve been asked to reproduce a figure from a black-and-white scan and struggled to distinguish between the different data sets. Those occasions stand out because they aren’t our everyday experience. We usually see the fully branded figure where everything appears clear.
For someone with a colour vision deficiency, however, that difficulty may be far more familiar. And the irony is that those figures have been designed specifically to create distinction.
Fortunately, the solutions don’t need to be complicated.
We can start with colour palettes that provide sufficient contrast, not only between foreground and background but between individual data sets. We can use different line styles alongside colour. For bar charts or filled areas, patterns or other visual treatments can provide another means of differentiation.
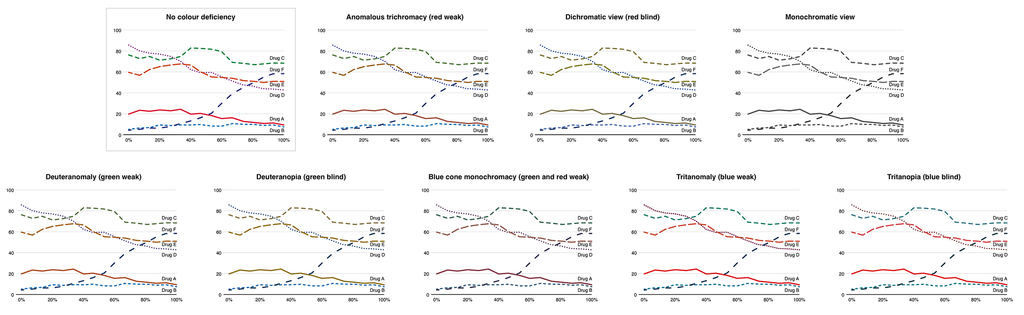
And there’s an even simpler option: clear labelling. Rather than relying solely on a legend, label the line, bar or data point directly wherever possible. As the example below demonstrates, combining colour with hierarchy, line styles and direct labelling can make exactly the same data much easier to interpret.
Digital formats give us even more options. Interactive charts can allow users to highlight an individual data set, select it to reveal its label or temporarily toggle other data sets on and off. This means identification no longer depends entirely on being able to distinguish one colour from another. Instead, the user has another way to isolate and understand the information they need.
Audio description can add another layer of support, particularly where a visualisation has a clear overall message or trend that can be communicated in words. Descriptions such as the highest or lowest line may also help where those relationships remain consistent, although they become less useful when lines cross or positions change. The aim isn’t necessarily to translate every visual element into audio, but to make sure the important information and relationships within the data can still be understood.
The principle is straightforward. Colour can communicate information, but it shouldn’t have to carry that information alone. And in digital environments, we have even more opportunities to give people different ways to access the same information.
This becomes increasingly important as our audiences grow. Digital content can reach more people than ever before. Congresses and events have become hybrid experiences, allowing people to participate without the financial, geographic or practical barriers associated with travel.
As that reach expands, so does the likelihood that someone in the audience will have an accessibility requirement. That might be colour vision deficiency, hearing loss that makes captions important, or a visual impairment that means information needs to work with assistive technologies.
Accessibility, then, isn’t separate from good communication. It’s part of it.
The debate perhaps never needed to be form versus function. Accuracy and clarity both matter, and effective design should help as many people as possible understand the information being presented.
Colour vision deficiency is only one aspect of accessibility in design. But by considering it as part of our everyday design process, rather than something to address after the fact, we can make our communications clearer, more inclusive and ultimately more effective.
Reference
1. Almustanyir S, Alsaqer A, Alharkan DH, et al. A Global Perspective of Color Vision Deficiency: Awareness, Diagnosis, and Lived Experiences. Healthcare. 2025;13(16):2031. https://doi.org/10.3390/healthcare13162031
LOVELIVE can help
Since 2010, we’ve worked with healthcare innovators who need to communicate complex ideas to demanding audiences. We get the regulatory constraints, we understand the multiple stakeholders, and we know how to translate technical innovation into compelling stories.
What we do:
- Brand identity and visual systems
- Creative strategy and messaging frameworks
- Data visualisation and diagrammatic storytelling
- Website UX/UI and service-explainer content
- Pitch decks, proposals and investor-facing materials
- Illustration, animation and motion graphics
- Report and insight publication design.